Monday, 2 November 2015

Assignment #4 - Creating graphs for your data

In completing this assignment I greatly reduced the amount of information that I was looking at so that i could look at only a couple pieces of information. While in future assignments, in the follow up courses, i am sure to use all of the information. 

PROGRAM - Include data and univariate and bivariate graphs
LIBNAME mydata "/courses/d1406ae5ba27fe300 " access=readonly;
DATA new;set mydata.addhealth_pds;
label h1ee1="How Much Do You Want To Go To College?"
h1ee2="How Likely Is It That You Will Go To College?"
h1wp11="How Disappointed Would Mom Be If You Did not Graduate College?"
h1wp15="How Disappointed Would Dad Be If You Did not Graduate College?";
IF h1ee1=8 THEN h1ee1=.;
IF h1ee1=6 THEN h1ee1=.;
IF h1ee2=8 THEN h1ee2=.;
IF h1ee2=6 THEN h1ee2=.;
IF h1wp11=6 then h1wp11=.; /* 6=refused*/
IF h1wp11=7 then h1wp11=.; /* 6=legit skip - no mom*/
IF h1wp11=8 then h1wp11=.; /* 6=don't know  IT IS ODD THAT THIS QUESTION DOES NOT HAVE RESPONSES FOR 9 AS ALL OTHER SIMILAR ONES DO??*/
IF h1wp15=6 then h1wp15=.; /* 6=refused*/
IF h1wp15=7 then h1wp15=.; /* 6=legit skip - no mom*/
IF h1wp15=8 then h1wp15=.; /* 6=don't know*/
IF h1wp15=9 then h1wp15=.; /* 6=not applicable*/

proc sort; by AID;

proc freq; tables h1ee1 h1ee2 h1wp11 h1wp15;

PROC GCHART; VBAR h1ee1/DISCRETE TYPE=PCT WIDTH=20; /* PCT= PERCENTAGES WIDTH 30 = 30 UNITS WIDE*/
PROC GCHART; VBAR h1ee2/DISCRETE TYPE=PCT WIDTH=20; /* PCT= PERCENTAGES WIDTH 30 = 30 UNITS WIDE*/
PROC GCHART; VBAR H1WP11/DISCRETE TYPE=PCT WIDTH=20;
PROC GCHART; VBAR h1WP15/DISCRETE TYPE=PCT WIDTH=20;
PROC UNIVARIATE; VAR H1EE1 H1EE2 H1WP11 H1WP15;
PROC GCHART; VBAR H1WP11/DISCRETE TYPE=MEAN SUMVAR=H1EE1;
PROC GCHART; VBAR H1WP15/DISCRETE TYPE=MEAN SUMVAR=H1EE1;

run;


GRAPHS


This is the primary question that I am focusing my hypothesis on - the desire or longing to attend college. it is my belief that there is a correlation between the college going habits of parents and their children. I believe that the perception that their parents want them to go to college, or that they will be disappointed if they do not gradate college, will correlate to the desire to go to college by respondent adolescents. The graph has a left skew and is unimodal. 

In this univariate graph we see the respondents ranking on how they feel that their mother would feel if they did not graduate from college. 1 being not disappointed, and 5 being very or highly disappointed. There is another almost exact graph for how their dad would feel. i did not include it as to not bore you with the details. More respondents fee that their parents would be disappointed if they did not graduate college. The graph has a left skew and is unimodal.  I need to look at why their is a deviation from the standard flow for responses of "2". why the drop?


This is the bivariate graph comparing the respondents desire to go to college, and their belief that their mother wants them to go to college and graduate. As you can see their is a positive relationship between these two variables, or a high desire to go to college as the perceived desire by the mother for them to graduate rises. 

Similar to the previous bivariate graph this graph for fathers also show a positive relationship between the respondents desire to attend college and the level at which they perceive their father wants them to graduate from college. 


Wednesday, 28 October 2015

Assignment #3 - Making Data Management Decisions

The more that i work on this project, the more I want to include. I love the idea of tying these pieces of data together to get a strong and telling picture. Granted, what I include has to be relevant to my hypothesis.

In this third assignment we had to ultimately clean up our data. Take out data that was not relevant, and look at how that good data left behind is distributed and what it might tell us so far. 

PROGRAM

LIBNAME mydata "/courses/d1406ae5ba27fe300 " access=readonly;
DATA new;set mydata.addhealth_pds;
label h1ee1="How Much Do You Want To Go To College?"
h1ee2="How Likely Is It That You Will Go To College?"
h1nm4="How Far Did Bio Mom Go?"
h1nf4="How Far Did Bio Dad Go?"
h1rm1="How Far Did Mom Go?"
h1rf1="How Far Did Dad Go?"
h1wp11="How Disappointed Would Mom Be If You Did not Graduate College?"
h1wp12="How Disappointed Would Mom Be If You Did Not Graduate High School?"
h1wp15="How Disappointed Would Dad Be If You Did not Graduate College?"
h1wp16="How Disappointed Would Dad Be If You Did Not Graduate High School?"
h1wp17H="In the past week have you talked to Mom about school work or grades?"
h1wp17I="In the past week have you worked with Mom on a project for school?"
h1wp17J="In the past week have you talked with Mom about other things to do with school?"
h1wp18h="In the past week have you talked to Dad about school work or grades?"
h1wp18I="In the past week have you worked with Dad on a project for school?"
h1wp18J="In the past week have you talked with Dad about other things to do with school?"
WANTSTOGOTOCOLLEGE="RESPONDENT INDICATES WANTING TO ATTEND COLLEGE"
THINKSWILLGOTOCOLLEGE="RESPONDENT BELIEVES THEY WILL GO TO COLLEGE";
IF h1ee1=8 THEN h1ee1=.;
IF h1ee1=6 THEN h1ee1=.;
IF h1ee2=8 THEN h1ee2=.;
IF h1ee2=6 THEN h1ee2=.;
IF h1nm4=96 THEN h1nm4=.;
IF h1nm4=97 THEN h1nm4=.;
IF h1nm4=98 THEN h1nm4=.;
IF h1nm4=12 THEN h1nm4=.;
IF h1nm4=11 THEN h1nm4=.;
IF h1nf4=96 THEN h1nf4=.;
IF h1nf4=97 THEN h1nf4=.;
IF h1nf4=98 THEN h1nf4=.;
IF h1nf4=12 THEN h1nf4=.;
IF h1nf4=11 THEN h1nf4=.;
IF h1rm1=96 THEN h1rm1=.;
IF h1rm1=97 THEN h1rm1=.;
IF h1rm1=98 THEN h1rm1=.;
IF h1rm1=12 THEN h1rm1=.;
IF h1rm1=11 THEN h1rm1=.;
IF h1rf1=96 THEN h1rf1=.;
IF h1rf1=97 THEN h1rf1=.;
IF h1rf1=98 THEN h1rf1=.;
IF h1rf1=12 THEN h1rf1=.;
IF h1rf1=11 THEN h1rf1=.;
IF h1wp11=6 then h1wp11=.; /* 6=refused*/
IF h1wp11=7 then h1wp11=.; /* 6=legit skip - no mom*/
IF h1wp11=8 then h1wp11=.; /* 6=don't know  IT IS ODD THAT THIS QUESTION DOES NOT HAVE RESPONSES FOR 9 AS ALL OTHER SIMILAR ONES DO??*/
IF h1wp12=6 then h1wp12=.; /* 6=refused*/
IF h1wp12=7 then h1wp12=.; /* 6=legit skip - no mom*/
IF h1wp12=8 then h1wp12=.; /* 6=don't know*/
IF h1wp12=9 then h1wp12=.; /* 6=not applicable*/
IF h1wp15=6 then h1wp15=.; /* 6=refused*/
IF h1wp15=7 then h1wp15=.; /* 6=legit skip - no mom*/
IF h1wp15=8 then h1wp15=.; /* 6=don't know*/
IF h1wp15=9 then h1wp15=.; /* 6=not applicable*/
IF h1wp16=6 then h1wp16=.; /* 6=refused*/
IF h1wp16=7 then h1wp16=.; /* 6=legit skip - no mom*/
IF h1wp16=8 then h1wp16=.; /* 6=don't know*/
IF h1wp16=9 then h1wp16=.; /* 6=not applicable*/
IF H1WP17H=6 THEN H1WP17H=.; /* 6= REFUSED*/
IF H1WP17H=7 THEN H1WP17H=.; /* 7= LEGIT SKIP NO MOM*/
IF H1WP17H=8 THEN H1WP17H=.; /* 8= DON'T KNOW*/
IF H1WP17I=6 THEN H1WP17I=.; /* 6= REFUSED*/
IF H1WP17I=7 THEN H1WP17I=.; /* 7= LEGIT SKIP NO MOM*/
IF H1WP17I=8 THEN H1WP17I=.; /* 8= DON'T KNOW*/
IF H1WP17J=6 THEN H1WP17J=.; /* 6= REFUSED*/
IF H1WP17J=7 THEN H1WP17J=.; /* 7= LEGIT SKIP NO MOM*/
IF H1WP17J=8 THEN H1WP17J=.; /* 8= DON'T KNOW*/
IF H1WP18H=6 THEN H1WP18H=.; /* 6= REFUSED*/
IF H1WP18H=7 THEN H1WP18H=.; /* 7= LEGIT SKIP NO MOM*/
IF H1WP18H=8 THEN H1WP18H=.; /* 8= DON'T KNOW*/
IF H1WP18I=6 THEN H1WP18I=.; /* 6= REFUSED*/
IF H1WP18I=7 THEN H1WP18I=.; /* 7= LEGIT SKIP NO MOM*/
IF H1WP18I=8 THEN H1WP18I=.; /* 8= DON'T KNOW*/
IF H1WP18J=6 THEN H1WP18J=.; /* 6= REFUSED*/
IF H1WP18J=7 THEN H1WP18J=.; /* 7= LEGIT SKIP NO MOM*/
IF H1WP18J=8 THEN H1WP18J=.; /* 8= DON'T KNOW*/
WANTSTOGOTOCOLLEGE= .;
IF (H1EE1=1) OR (H1EE1=2) THEN WANTSTOGOTOCOLLEGE=1;
IF (H1EE1=3) THEN WANTSTOGOTOCOLLEGE=2;
IF (H1EE1=4) OR (H1EE1=5) THEN WANTSTOGOTOCOLLEGE=3;
THINKSWILLGOTOCOLLEGE= .;
IF (H1EE2=1) OR (H1EE2=2) THEN THINKSWILLGOTOCOLLEGE=1;
IF (H1EE2=3) THEN THINKSWILLGOTOCOLLEGE=2;
IF (H1EE2=4) OR (H1EE2=5) THEN THINKSWILLGOTOCOLLEGE=3;
proc sort; by AID;
proc freq; tables h1ee1 WANTSTOGOTOCOLLEGE h1ee2 THINKSWILLGOTOCOLLEGE H1nm4 h1nf4 h1rm1 h1rf1 h1wp11 h1wp12 h1wp15 h1wp16 h1wp17h h1wp17I h1wp17J h1wp18h h1wp18I h1wp18J;
run;

OVERVIEW
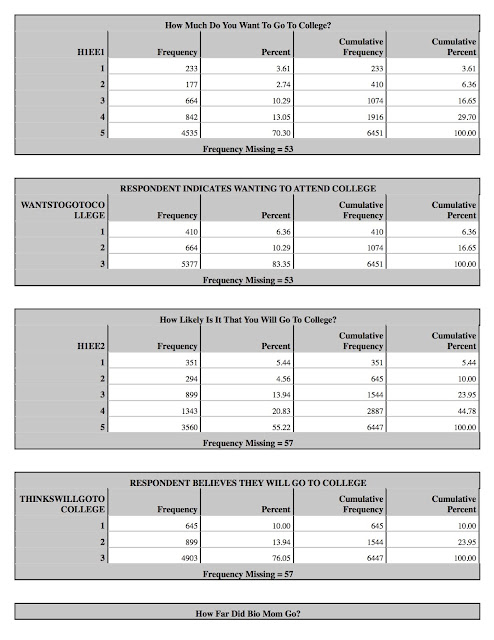
Running the program to display the tables was pretty straight forward. The two difficulties that i encountered were (i.) figuring out what data was not relevant and (ii.) figuring out how to recoding a couple of the variables to make the easier to understand. I will explain - 

Most of the data in the Adolescent Health study is categorical, and follows very specific clustering of responses. Therefore, once i figured out, using the code book, what the codes were for non responses (refused to give one or did not know the answer) and non-relevant responses (there is no Mom so how can they reply) i was able to remove them (indicated in each chart with Frequency Missing value). 

In other questions that responses were giving on a scale, usually 1 (being low) and 5 (being high). For my review i wanted to know more clear cut answers - did they think it or not. As you can see in the first two questions about if the respondent wants to go to college (H1EE1) and believes they will go (H1EE2), i was able to create new charts that group together those responding with low (responses of 1 and 2), medium (3) or high (4 and 5). I believe that organizing the data like this will allow me to more quickly show the connection between college going believe and parental history. 

CHARTS

Monday, 26 October 2015

Data Management and Visualization: Second Assignment - Running Your First Program

I thought this was going to be much harder than it actually was! Just looking at code, that we had to eventually type, just does not seem to make any sort of sense to my brain. However, once watching the videos and taking it one step at a time, it was much easier to produce.

My quest for this overall assignment is to assess the desire to go to college, and how or if that is connected to parents view of college and if they attended college. I used the Adolescent Health data provided as part of the course.

Below are my responses to three questions asked in our assignment.

1.) MY PROGRAM


1 - LIBNAME mydata "/courses/d1406ae5ba27fe300 " access=readonly;
2 - DATA new;set mydata.addhealth_pds;
3 - label h1ee1="How Much Do You Want To Go To College?"
h1ee2="How Likely Is It That You Will Go To College?"
h1nm4="How Far Did Bio Mom Go?"
h1nf4="How Far Did Bio Dad Go?"
h1rm1="How Far Did Mom Go?"
h1rf1="How Far Did Dad Go?";
4 - proc sort; by AID;
5 - proc freq; tables h1ee1 h1ee2 H1nm4 h1nf4 h1rm1 h1rf1;
6 - run;


2) MY OUTPUT VARIABlES AS FREQUENCY TABLES


The FREQ Procedure
How Much Do You Want To Go To College?
H1EE1FrequencyPercentCumulative
Frequency
Cumulative
Percent
12333.582333.58
21772.724106.30
366410.21107416.51
484212.95191629.46
5453569.73645199.19
6140.22646599.40
8390.606504100.00
How Likely Is It That You Will Go To College?
H1EE2FrequencyPercentCumulative
Frequency
Cumulative
Percent
13515.403515.40
22944.526459.92
389913.82154423.74
4134320.65288744.39
5356054.74644799.12
6140.22646199.34
8430.666504100.00
How Far Did Bio Mom Go?
H1NM4FrequencyPercentCumulative
Frequency
Cumulative
Percent
1430.66430.66
21141.751572.41
360.091632.51
42323.573956.07
5380.584336.66
6410.634747.29
7761.175508.46
8871.346379.79
9270.4266410.21
11330.5169710.72
12300.4672711.18
9630.0573011.22
97576488.62649499.85
98100.156504100.00
How Far Did Bio Dad Go?
H1NF4FrequencyPercentCumulative
Frequency
Cumulative
Percent
11081.661081.66
22493.833575.49
3130.203705.69
475711.64112717.33
5570.88118418.20
6821.26126619.46
71742.68144022.14
83244.98176427.12
91161.78188028.91
111892.91206931.81
12961.48216533.29
9620.03216733.32
97428165.82644899.14
98560.866504100.00
How Far Did Mom Go?
H1RM1FrequencyPercentCumulative
Frequency
Cumulative
Percent
12634.042634.04
25688.7383112.78
3410.6387213.41
4181127.84268341.25
52173.34290044.59
64266.55332651.14
777011.84409662.98
8124119.08533782.06
95127.87584989.93
1070.11585690.04
111792.75603592.79
12420.65607793.43
9640.06608193.50
973705.69645199.19
98530.816504100.00
How Far Did Dad Go?
H1RF1FrequencyPercentCumulative
Frequency
Cumulative
Percent
12193.372193.37
23795.835989.19
3270.426259.61
4130220.02192729.63
51302.00205731.63
62543.91231135.53
75127.87282343.40
892214.18374557.58
95358.23428065.81
1090.14428965.94
111552.38444468.33
12500.77449469.10
9670.11450169.20
97195230.01645399.22
98500.77650399.98
9910.026504100.00

3) A FEW SENTENCES DESCRIBING MY FREQUENCY DISTRIBUTIONS

Most of the data results are easy to understand, as there is so much repetition in the responses. I was working with questions who's answer results were placed on scales (1 to 5), or for grades completed making a review of the data reasonably simple. 

In the first two tables 1 is low, and 5 is high, 6 is refused to answer, and 8 is don't know. 

In the rest of the charts each number represents a grade (1st grade through 12th grade); however there are a couple responses that vary from this logical sequence including: 96 = refused, 97 = legitimate skip, 98 = don't know, 99 = not applicable.